

Volatility-Targeted Momentum Strategy: Robustness Review.

1. Parameter sensitivity: fragile peak or stable plateau?
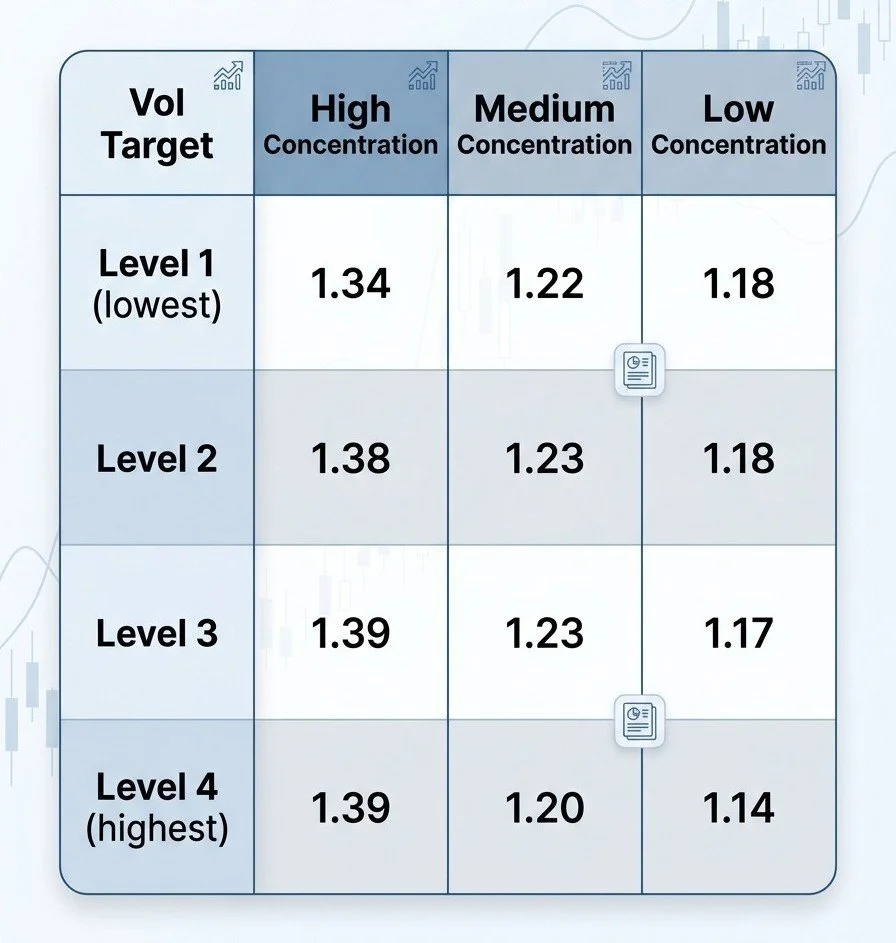
Sharpe ratio across 12 configurations (volatility target × portfolio concentration):
Result: Pass. Sharpe stays in a tight 1.14–1.39 band across every combination. There is no cliff and no single lucky cell, so this is a stable plateau rather than an overfit spike.
Two gradients stand out:
Concentration helps. The high-concentration column beats the low-concentration column in every row.
Higher volatility targets raise returns but deepen drawdowns.
The baseline configuration (medium concentration) is deliberately not the peak. The high-concentration variants score better on every metric, which supports concentrating more.
2. Sub-period stability: one lucky stretch or a persistent edge?
By half: first half Sharpe 0.50, second half Sharpe 1.84. The edge holds in both halves, but most of the performance comes from the recent period.
By year: positive in 7 of 8 years. The only losing year was 2022 (−11.6%), and that still beat the benchmark index (−18.6%). The regime filter did its defensive job.
Against the benchmark: outperformed in 5 of 8 years. It lagged in strong bull years (2019, 2021, 2023) and outperformed in harder conditions (the 2022 bear market) and in 2024–2026. That is the expected pattern for a regime-filtered strategy: it gives up some upside to avoid the worst drawdowns.
Summary
Not overfit: the parameter surface is flat and well-behaved.
Not a single fluke: positive in 7 of 8 years, and both halves are positive.
Caveats:
Performance is concentrated in the most recent ~2.5 years (second-half Sharpe about 3.7× the first half), so the long-run edge is less proven than the headline suggests.
Survivorship bias in the dataset inflates absolute returns. A truly clean test needs point-in-time data that includes delisted securities.
Part A: Baseline configuration
Part B: Concentrated variant vs. baseline
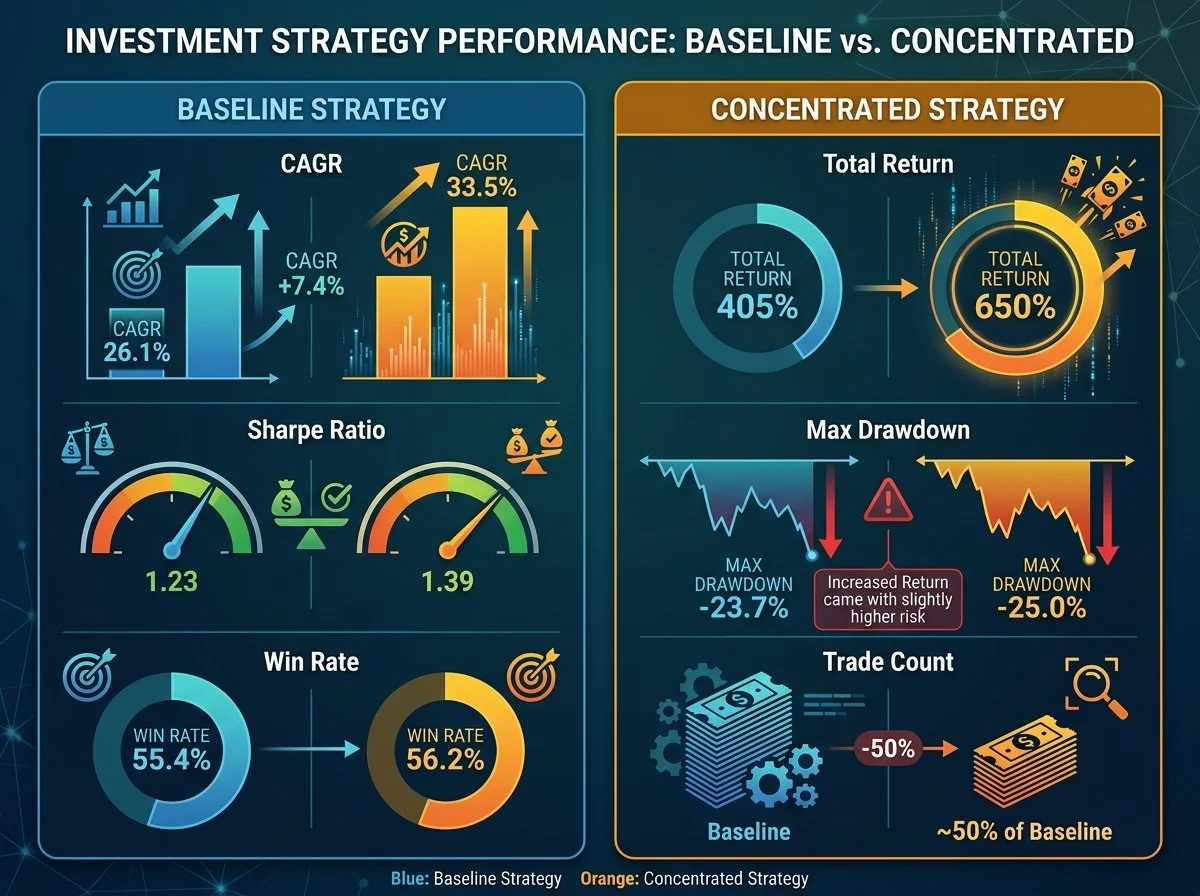
Only portfolio concentration was changed. The volatility target stayed the same so the comparison is like for like.
Head-to-head (full window, same cost assumptions)
Concentration improves results at little cost. It adds about 7.4 points of CAGR and a materially better Sharpe for only about 1.3 extra points of drawdown. Risk-adjusted return improves, so this is not just extra leverage under another name.
1. Parameter sensitivity: still a stable plateau?
Yes. Around the concentrated configuration, Sharpe ranges from 1.27 to 1.48, a tight band with no cliff. Both tighter concentration and higher volatility targets raise returns in a consistent, one-directional way. The most concentrated setting tested is the strongest corner of the grid (Sharpe 1.44–1.48).
2. Sub-period stability
By half: first half Sharpe 0.62, second half Sharpe 2.03. The recent-period weighting is the same as the baseline and slightly stronger, because concentration amplifies both the strong and the weak stretches.
By year: positive in 7 of 8 years. The only loss was 2022 (−10.6%), which still beat the benchmark (−18.6%). It outperformed the benchmark in 5 of 8 years, with the same regime pattern: it lagged strong bull markets and won the difficult years.
One year carries a lot of the result: 2024 returned +110.5% at a Sharpe of 3.06. A single standout year in a concentrated portfolio is the kind of result to treat with suspicion, and it makes up a large share of the full-window edge.
Summary
The concentrated variant beats the baseline on risk-adjusted return and stays robust across the parameter grid. This confirms the earlier "concentration helps" finding.
Caveats:
Performance leans even more on recent years (second half about 3.3× the first) and depends heavily on 2024.
A concentrated book carries more single-name blow-up risk than the Sharpe ratio shows.
The survivorship bias caveat still applies, so absolute figures are optimistic.
Overall assessment: the concentrated configuration is the stronger research candidate. However, the edge is concentrated enough in recent years that the headline CAGR should not be treated as a forecast. The grid suggests that even tighter concentration looks better on paper, which is usually where a model starts fitting noise..
What Sets Us Apart
Downside Protection & Regime Défense:
The regime filter acts as a shock absorber. While it gives up some upside during strong bull runs, it significantly outperforms during market downturns—for instance, losing only ~10.6%–11.6% during the 2022 bear market compared to the benchmark's -18.6% drop.
Parameter Stability (Not Overfit):
Performance rests on a broad, stable plateau across parameter grid tests rather than a fragile "lucky peak." Across 12 combinations of volatility targets and portfolio concentration, the Sharpe ratio remains in a tight, resilient band (1.14–1.39).
High Concentration Efficiency:
Concentrating the portfolio delivers significantly stronger returns at minimal added risk. Compared to the baseline, the concentrated variant increases CAGR from 26.1% to 33.5% and improves the Sharpe ratio to 1.39 for only 1.3 percentage points of additional drawdown, while cutting required trades by roughly half (~50%).