Utilising your resources effectively is the key to mastering strategies. Popular methods require discipline, structure, and a deep understanding of the criteria that drive success.
To help you strengthen not only your trading but also your financial and investment management, you can now download two powerful Excel workbooks — completely free.
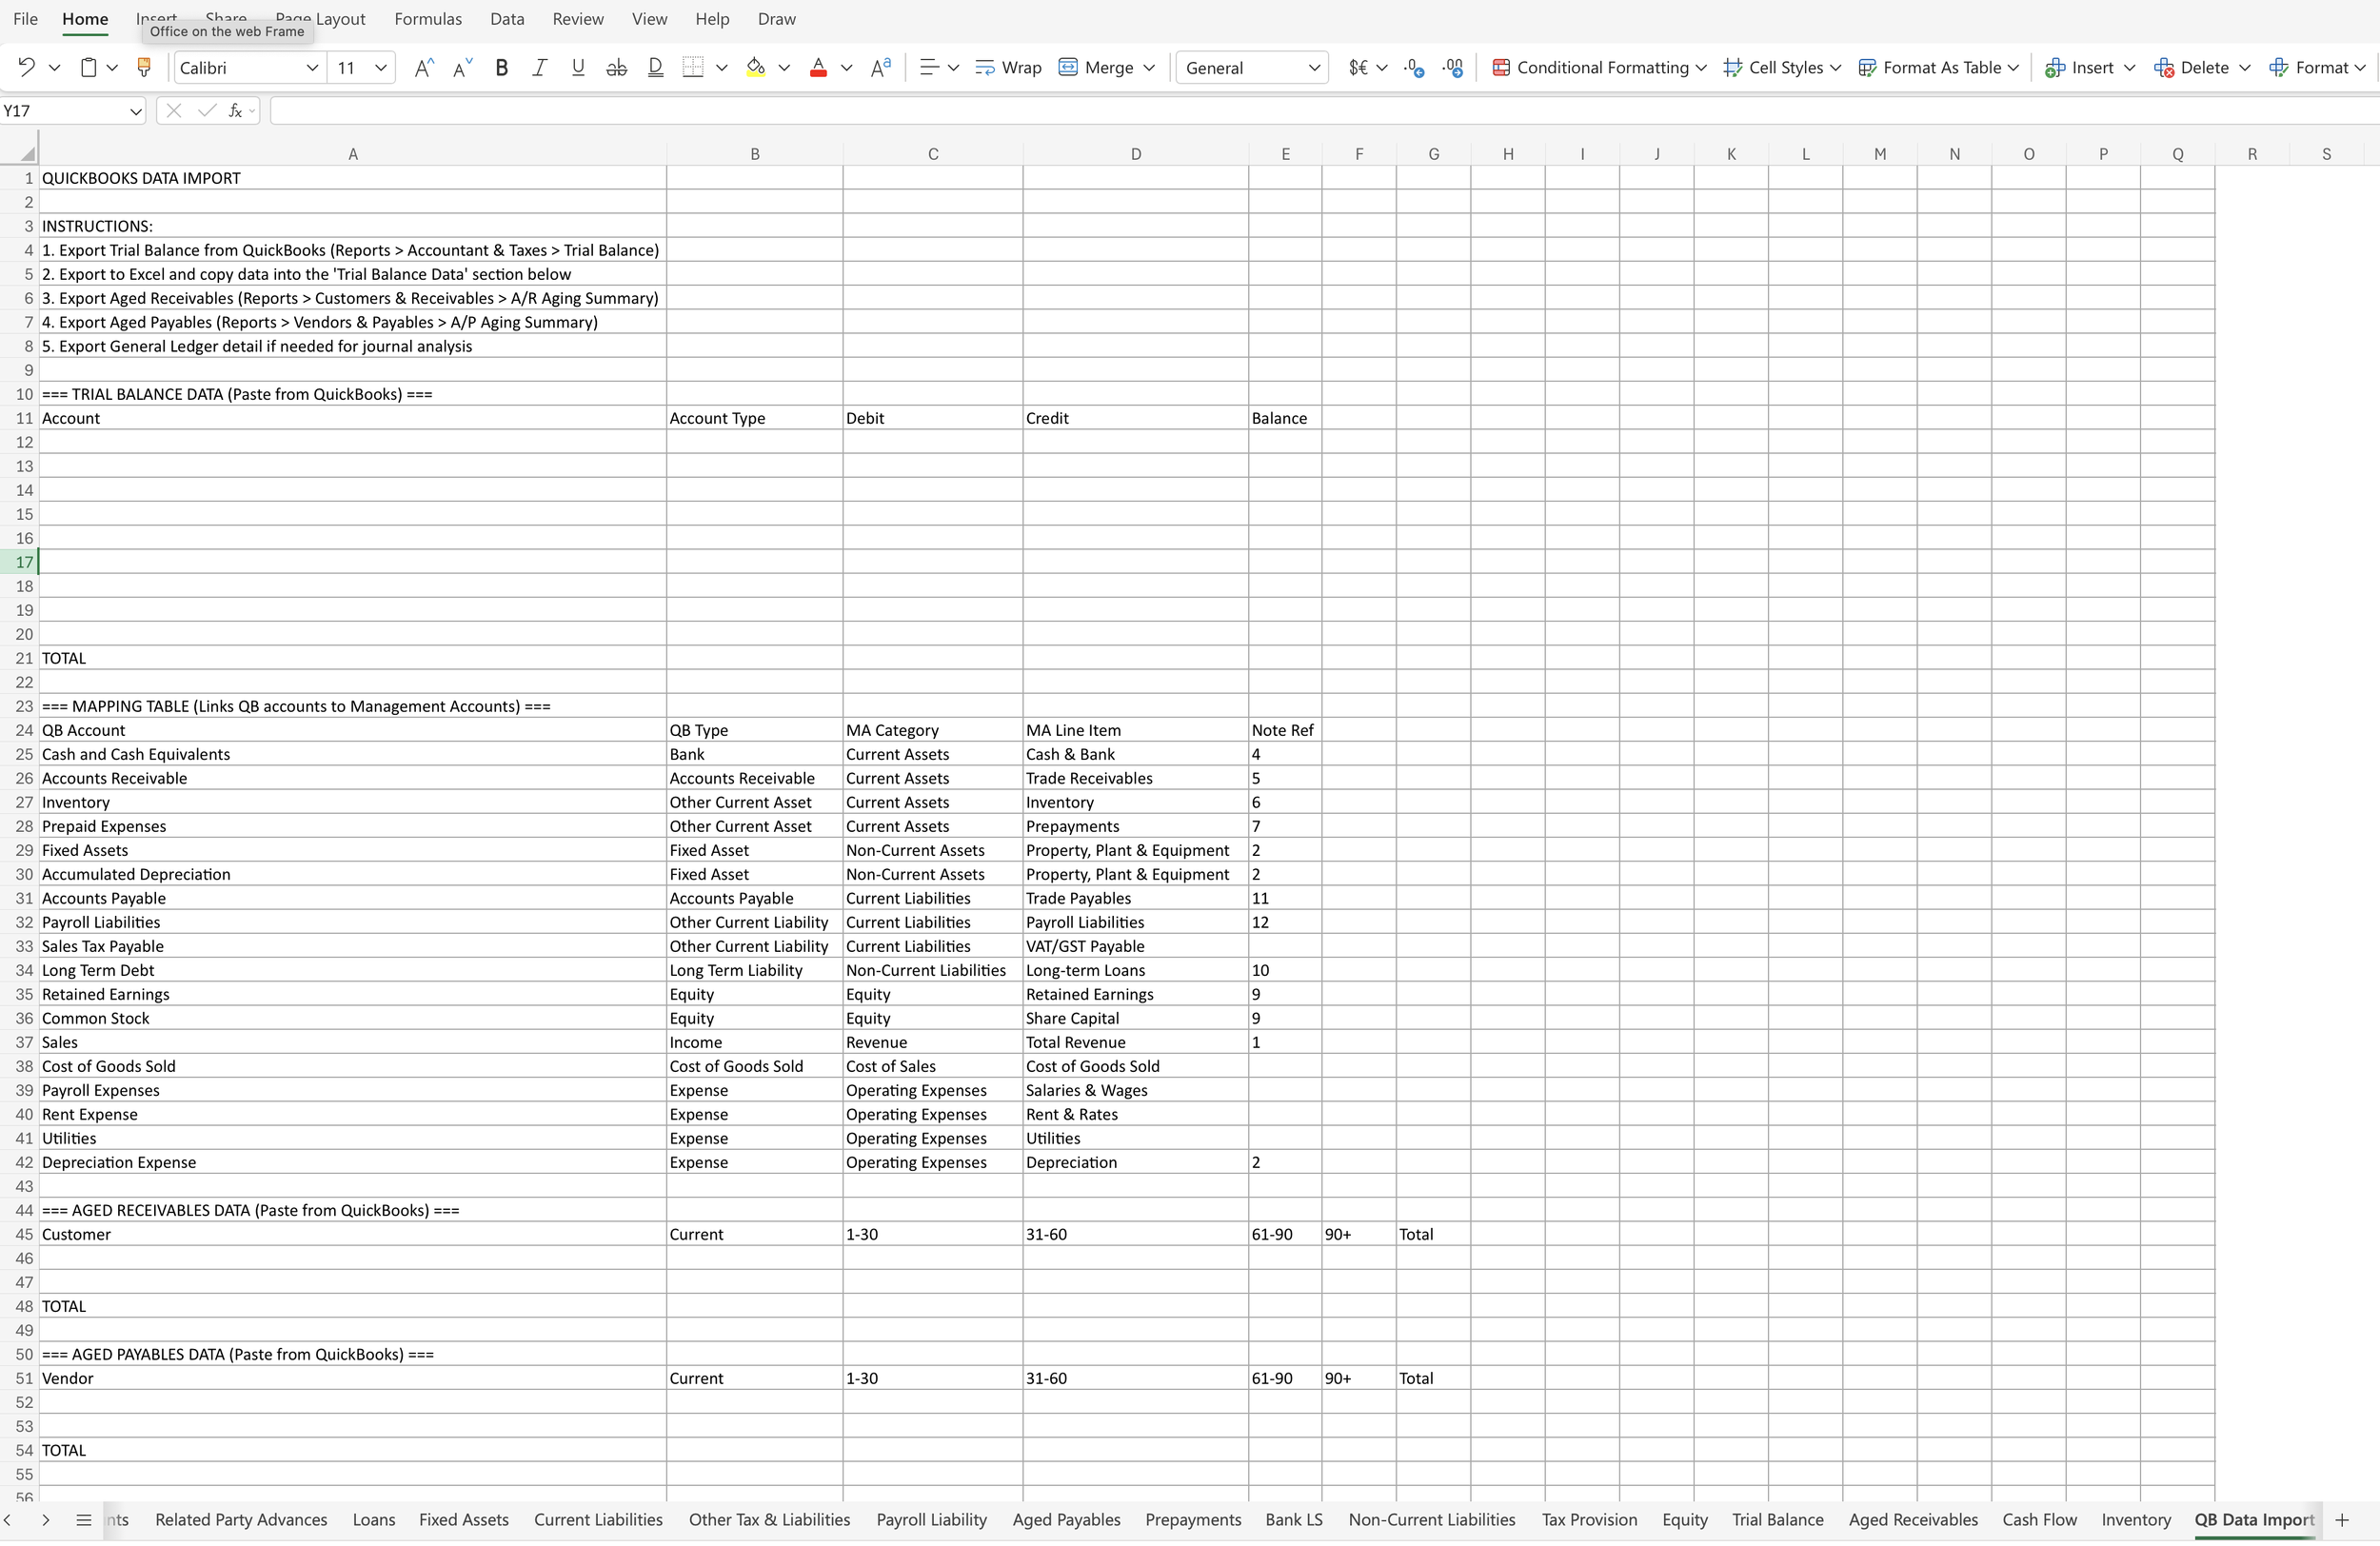
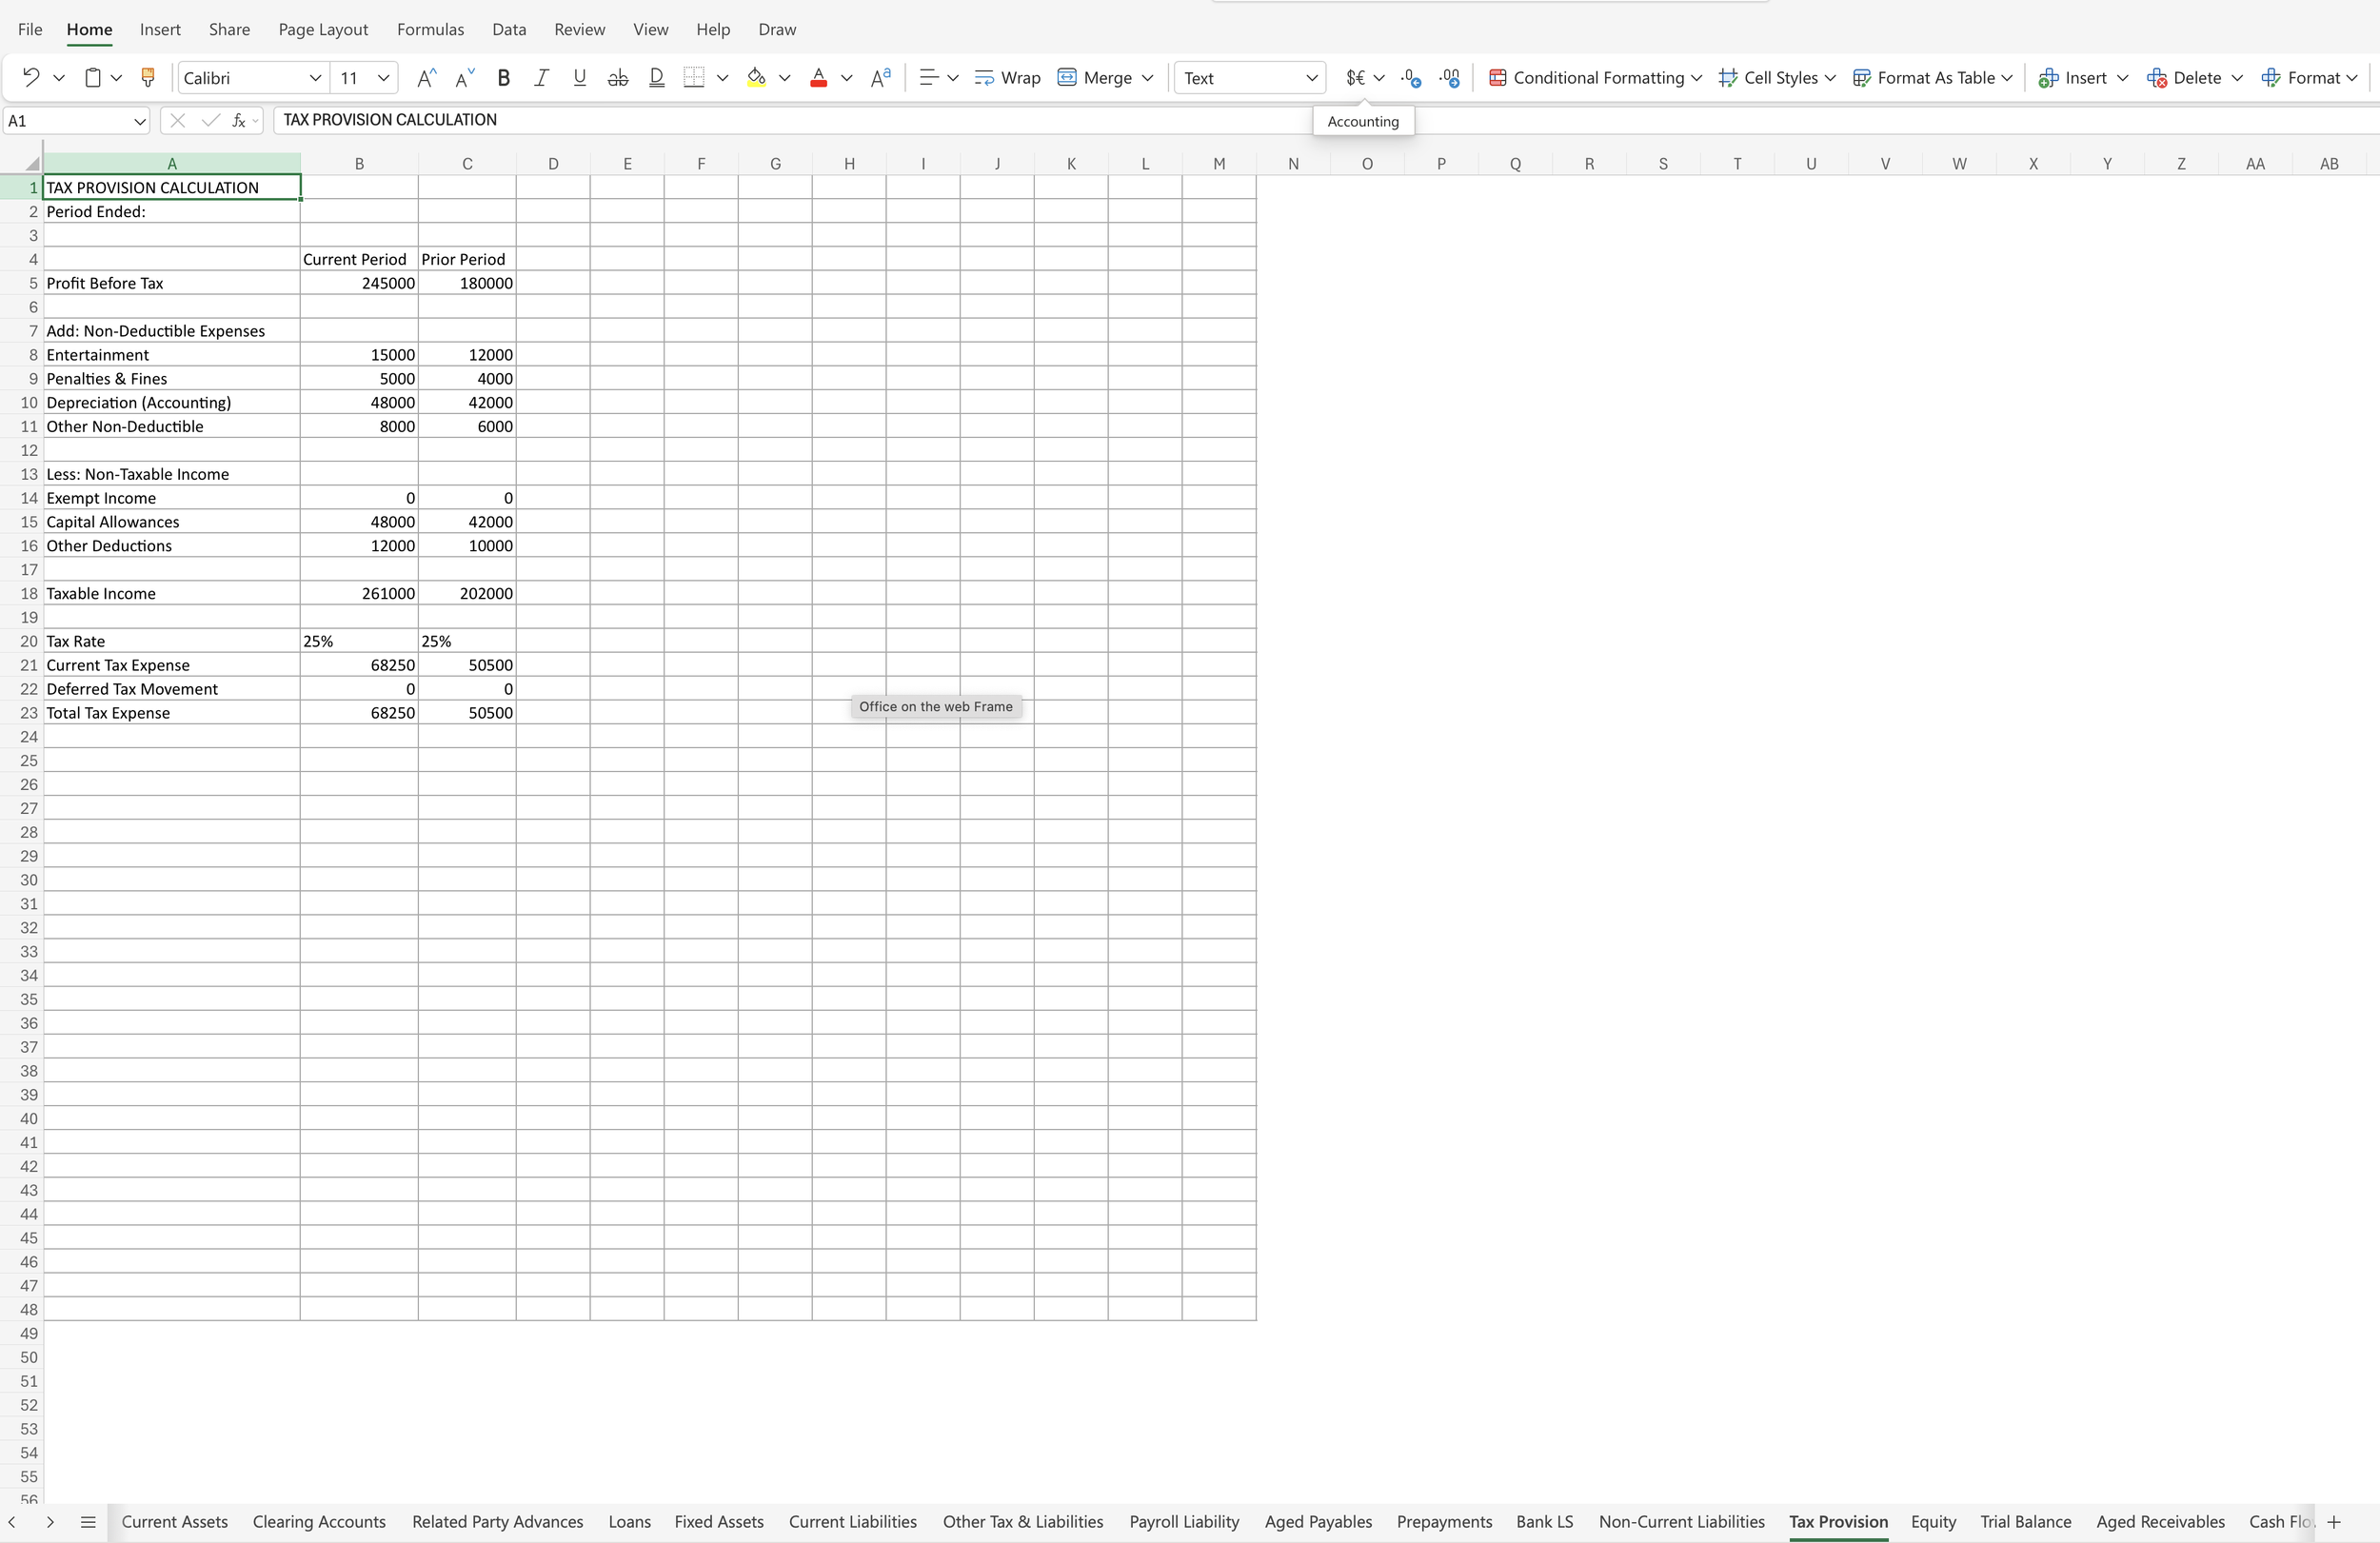
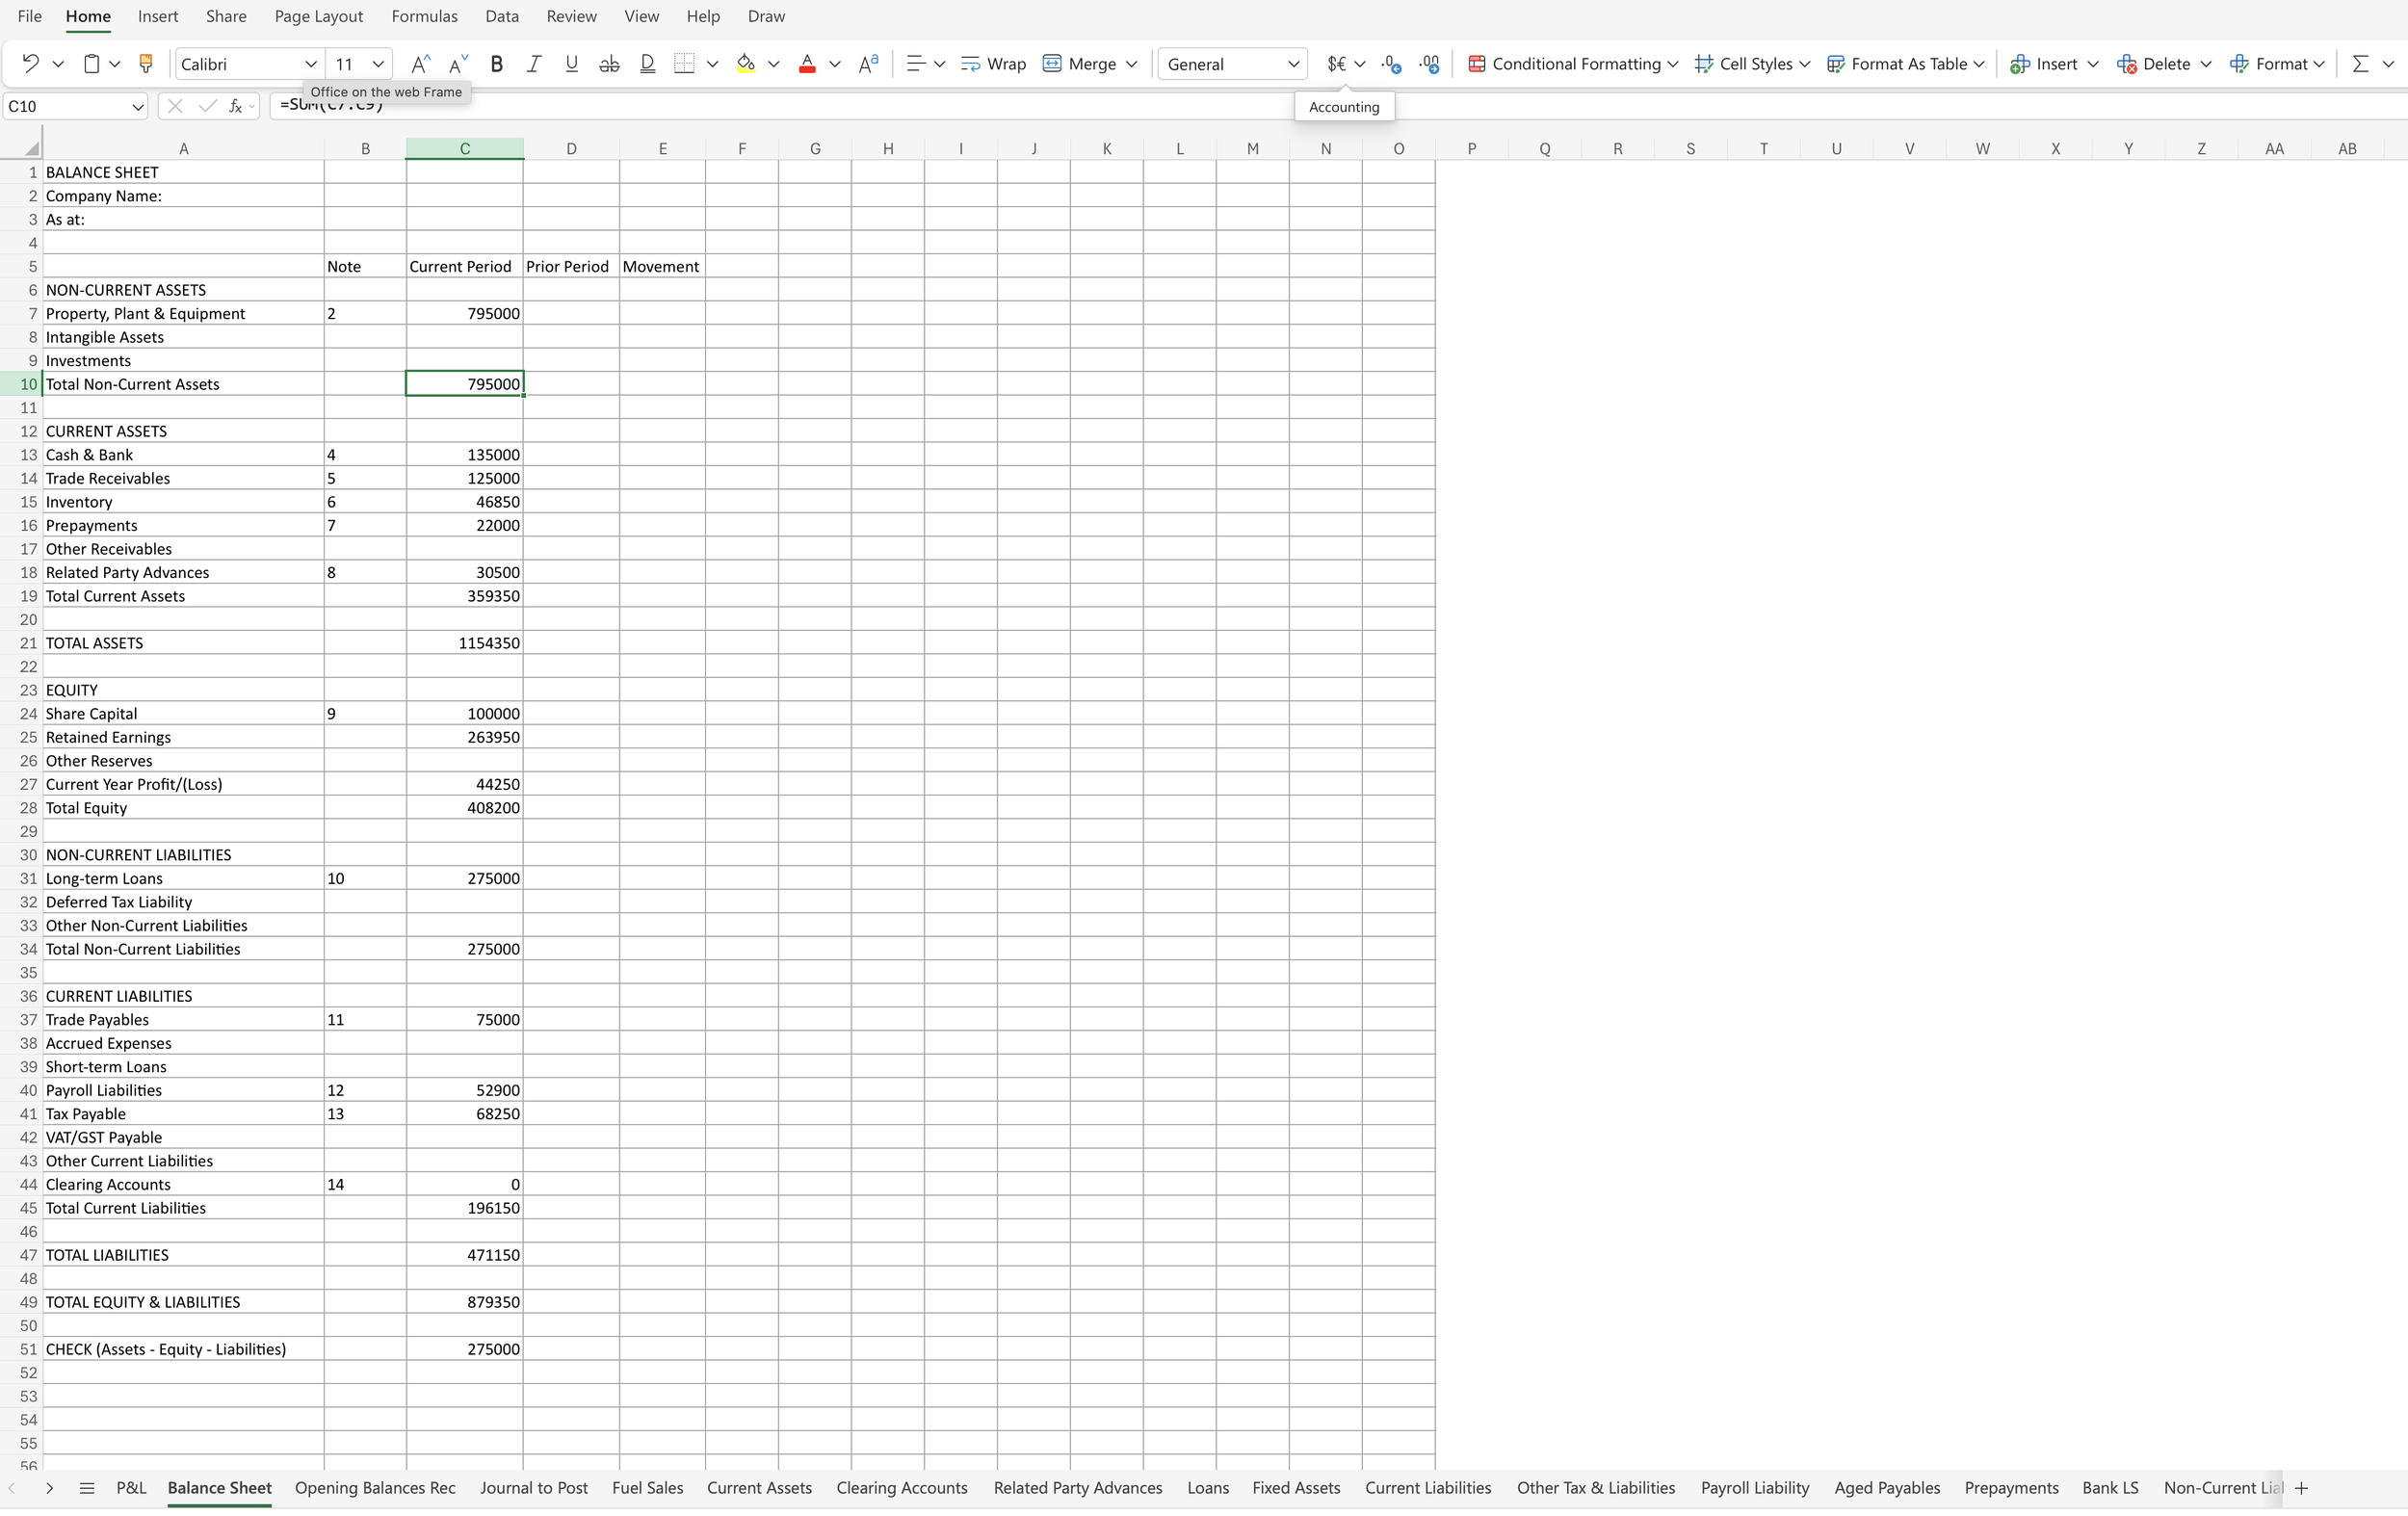
1. Management Accounts Workbook (for Accountants & Business Owners) Designed for professionals who want clarity and precision, this workbook helps you: Track income, expenses, and profit margins effortlessly. Generate monthly management accounts and cash flow statements automatically. Analyse business performance with intuitive dashboards and KPI summaries. Save hours of reporting while maintaining full financial transparency. Benefits: Make informed decisions faster with accurate financial insights at your fingertips.
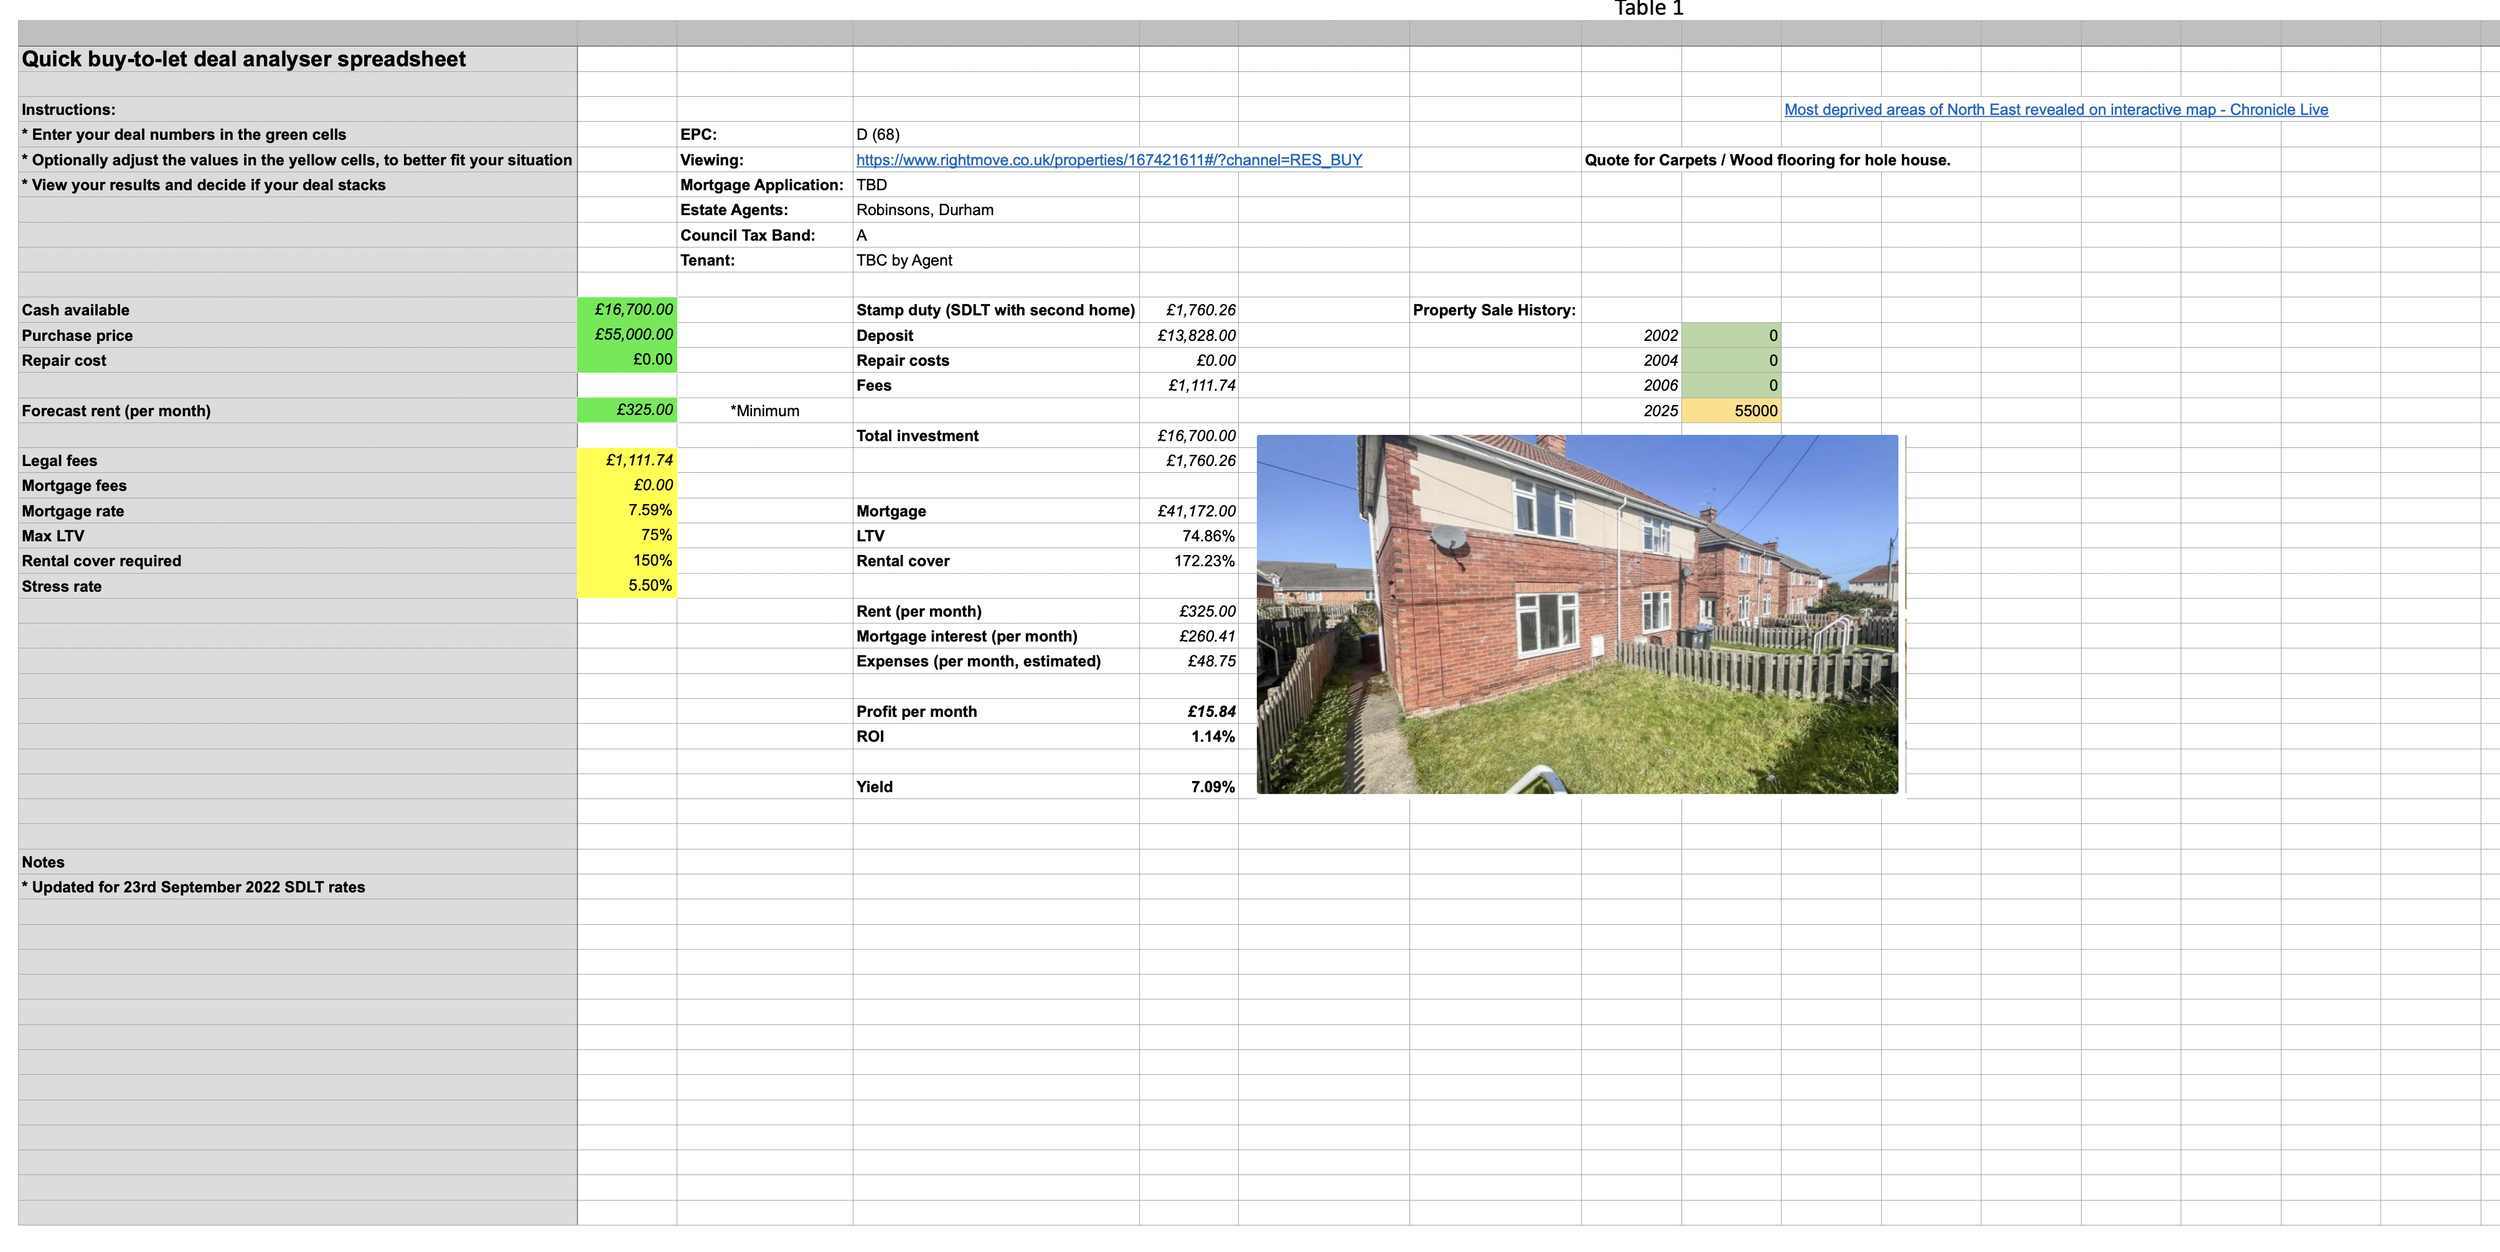
2. Property Quick Deal Analyser (for First-Time Landlords & Investors) Perfect for anyone exploring the property market, this spreadsheet lets you: Instantly calculate yield, ROI, and cash flow on any property deal. Compare multiple properties side-by-side to identify the best opportunities. Include mortgage costs, maintenance, and taxes for realistic projections. Simplify complex deal analysis into a clear, professional summary. Benefits: Evaluate potential investments with confidence — before committing a single pound.
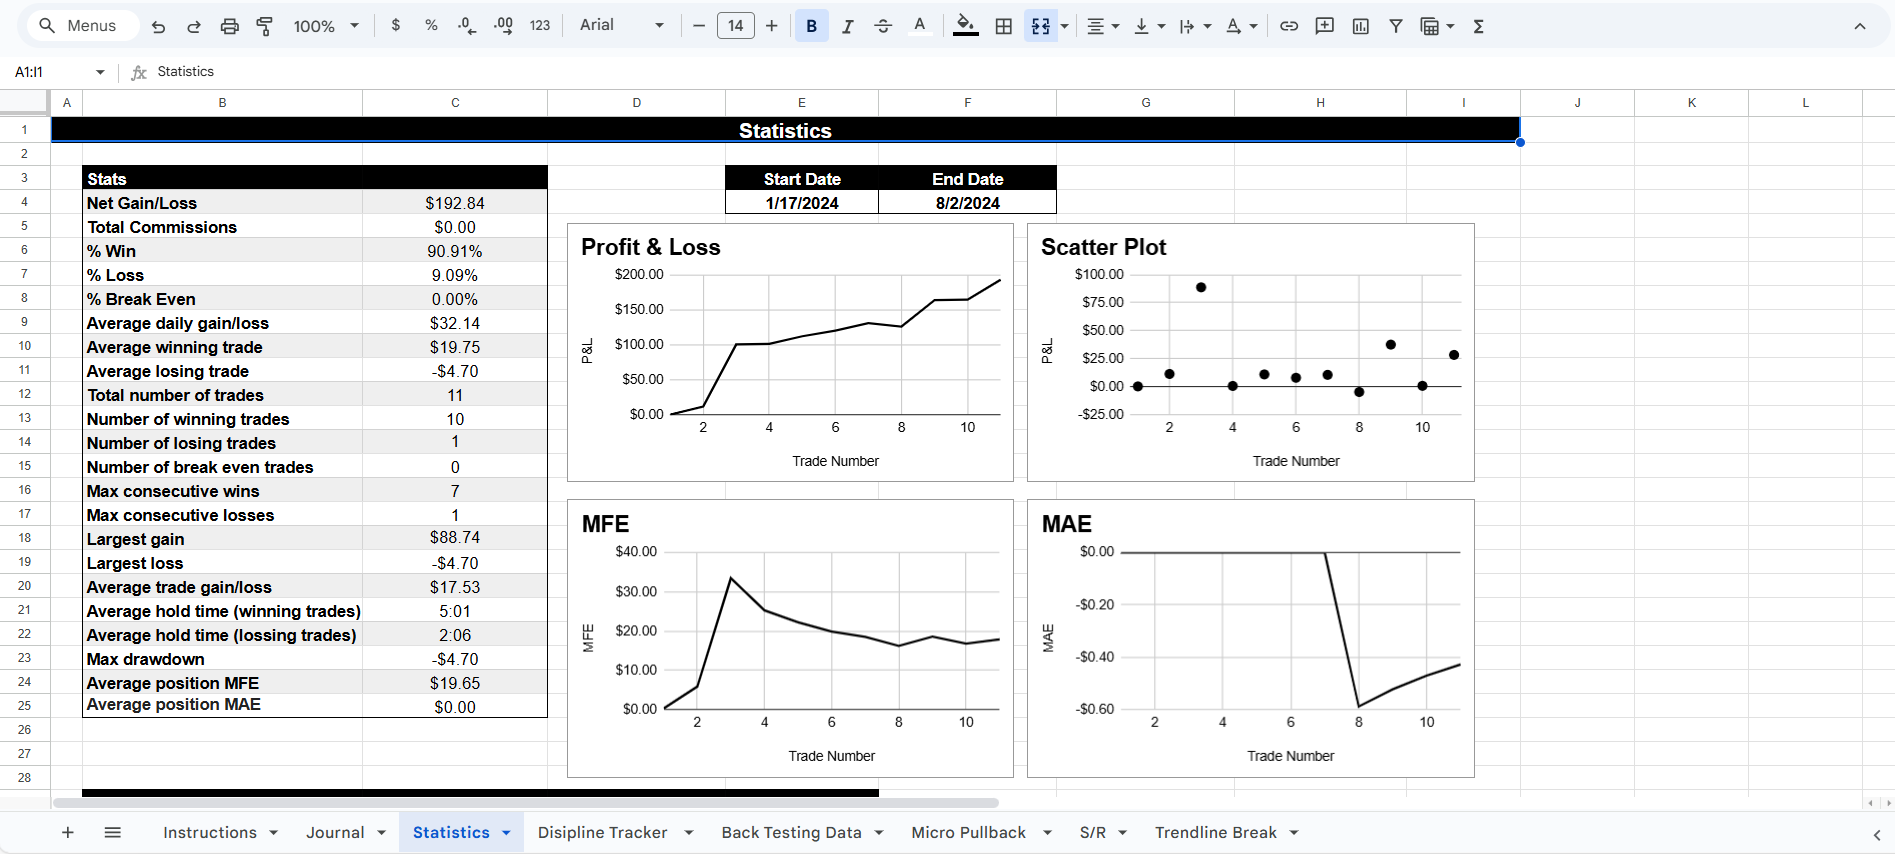
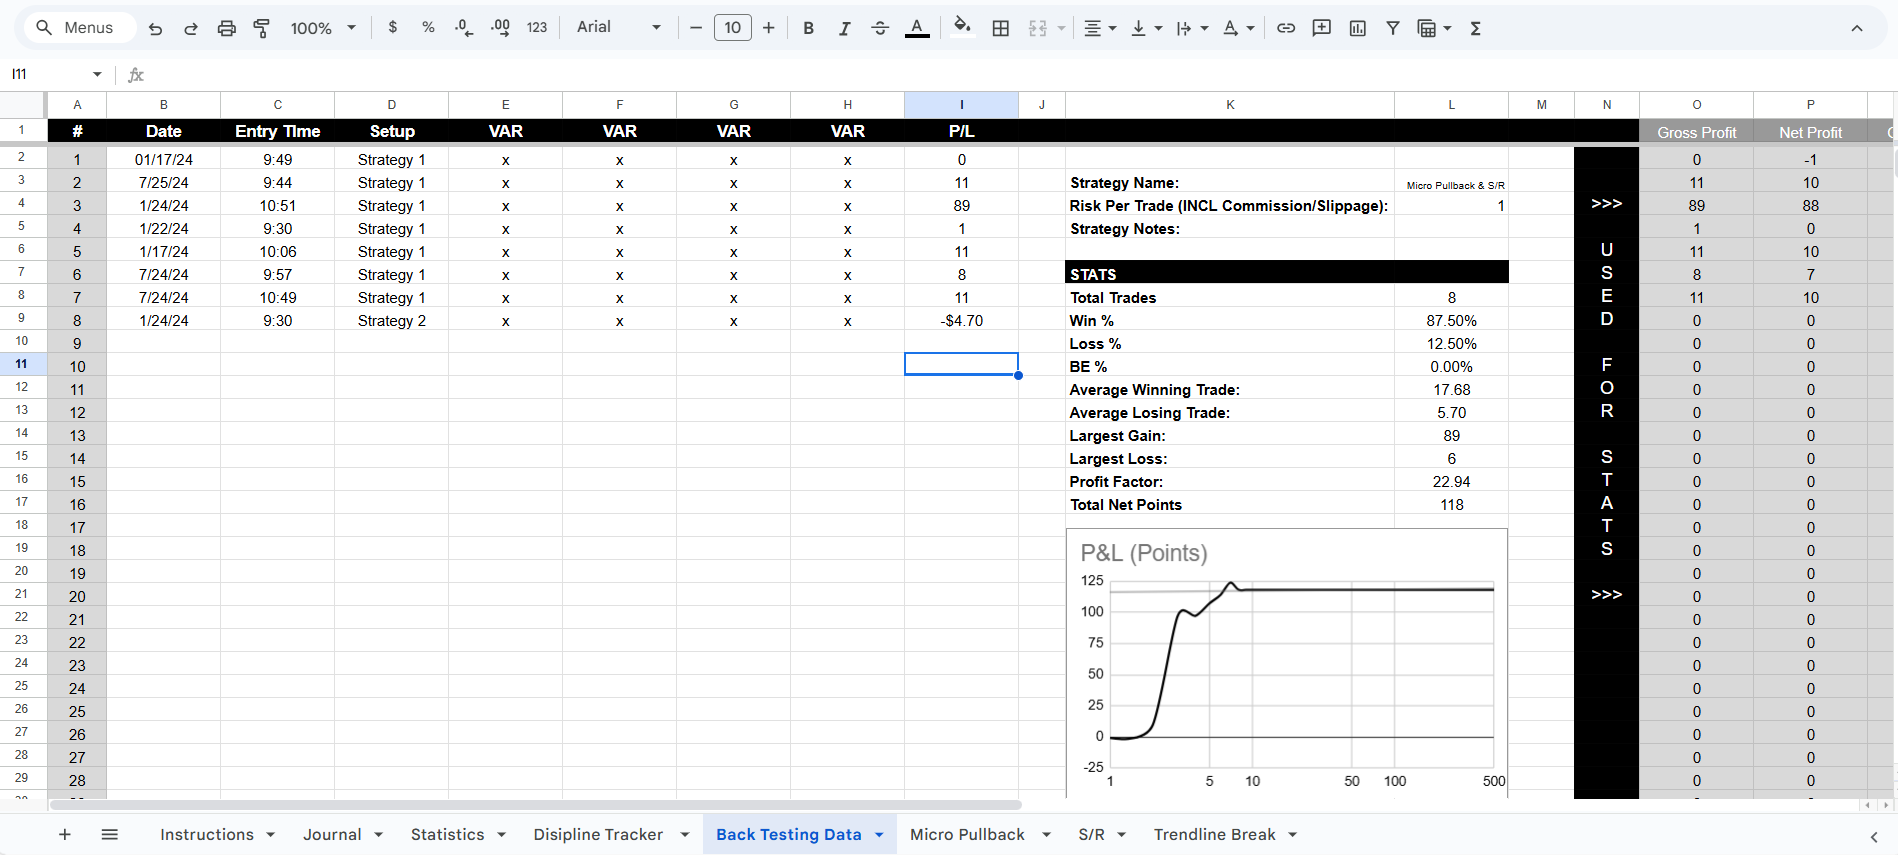
Plus: Download a Free Day Trading Journal (Excel) to track trades, review performance, and sharpen your strategy over time.
From trading strategies to property investments and business management, these resources are built to help you work smarter, make data-driven decisions, and accelerate your results, download your free Excel tools today and start building the financial confidence that drives long-term success.